ArkTech delivers end-to-end analytics solutions, from data modeling and automation to interactive dashboards and executive reporting.
Explore the projects below to see real-world implementations, interactive reports, and walkthrough videos that highlight technical depth and business impact.
Design and development of analytics solutions that transform raw data
into actionable insights for stakeholders.
Focus: Power BI, Tableau, Excel, r, DAX, KPI development, data visualization,
business intelligence, stakeholder reporting
Data Engineering
Building and maintaining scalable data pipelines to support analytics,
reporting, and downstream AI workloads.
Focus: SQL, Python, ETL pipelines, data modeling,
data quality, automation
AI & Automation
Development of AI-driven workflows and automation solutions that improve
efficiency and decision-making.
Focus: Data Analysis, visualization, Storytelling, Data Engineering, AI integration, Automation workflows,
Intelligent Systems, Applied Machine Learning
Featured Projects
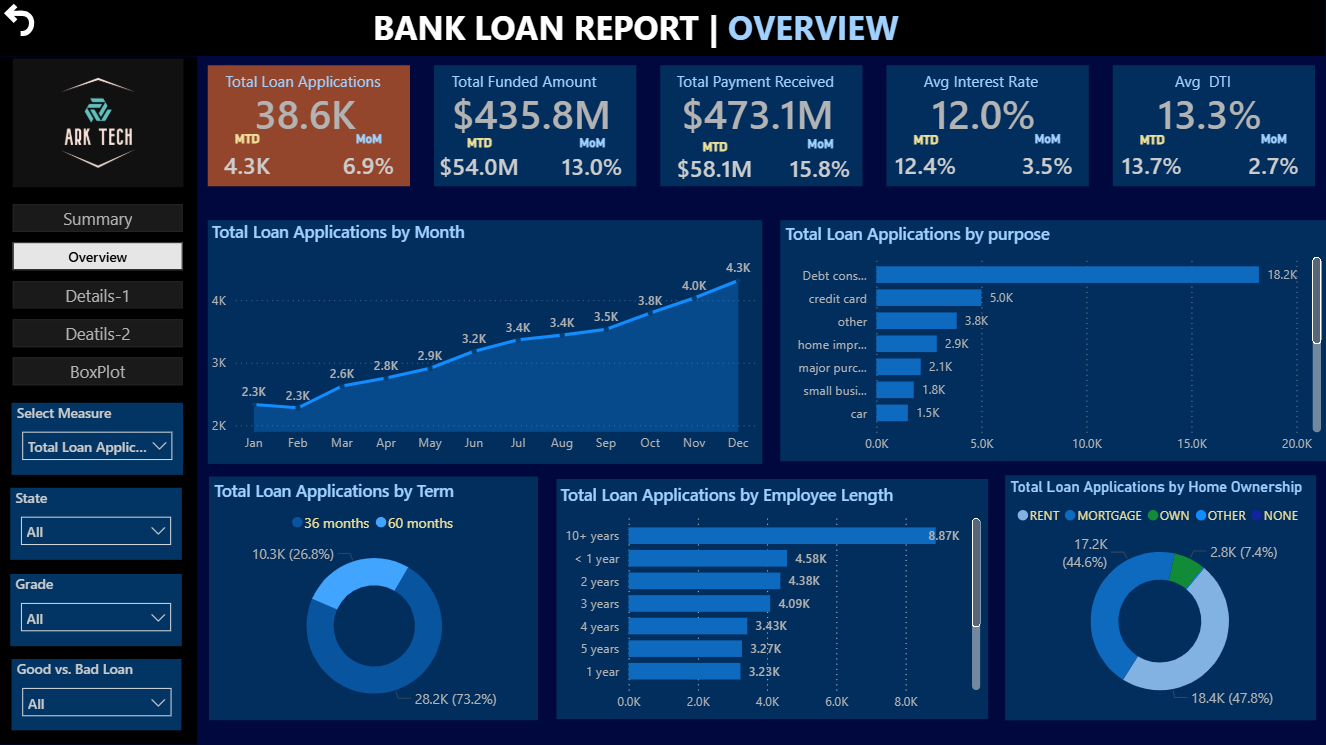
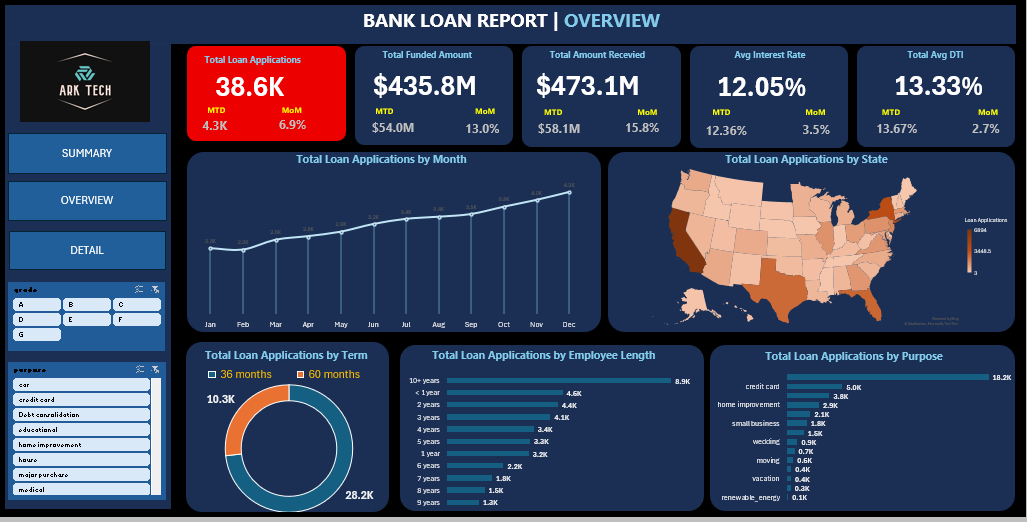
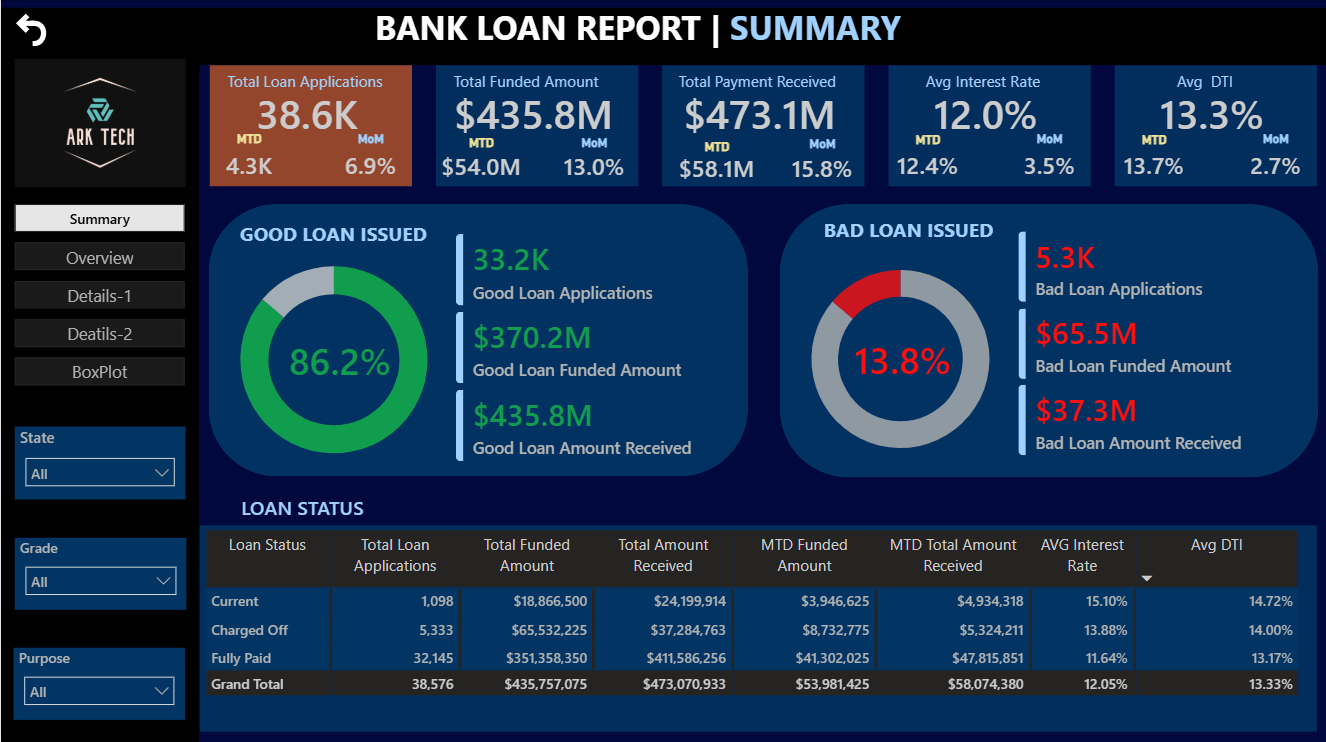
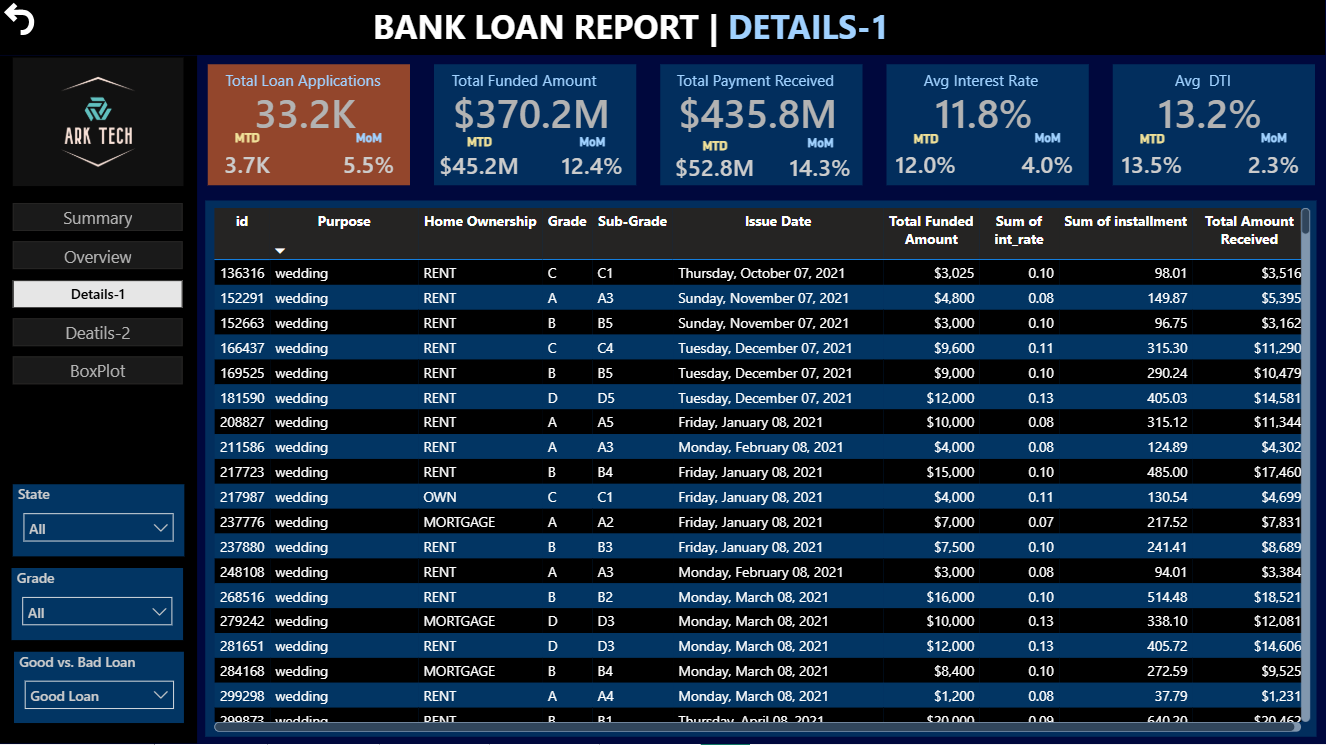
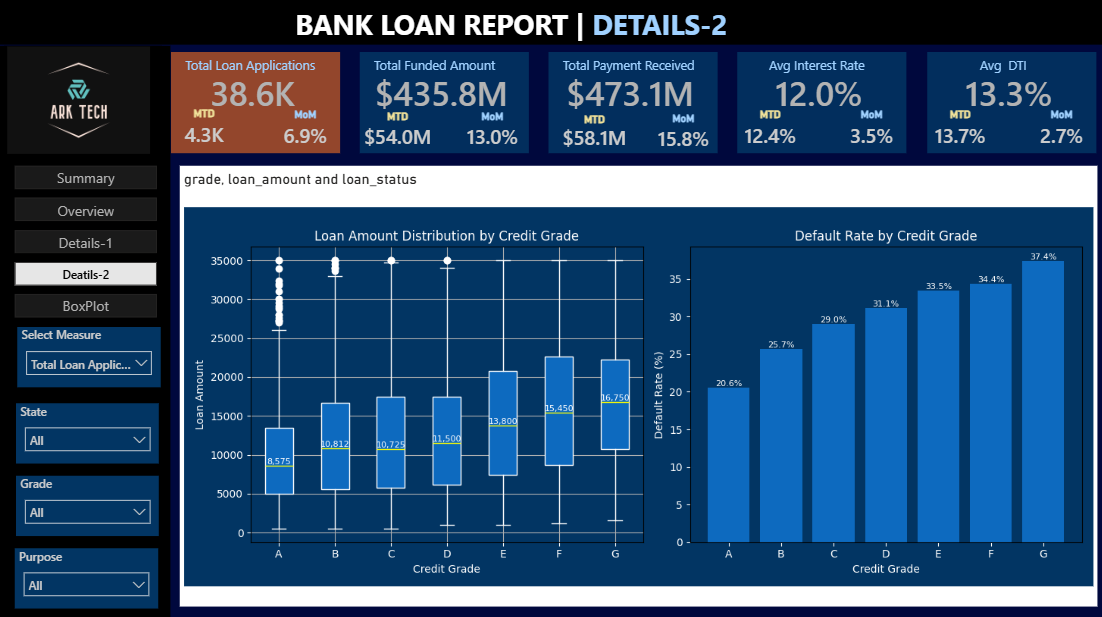
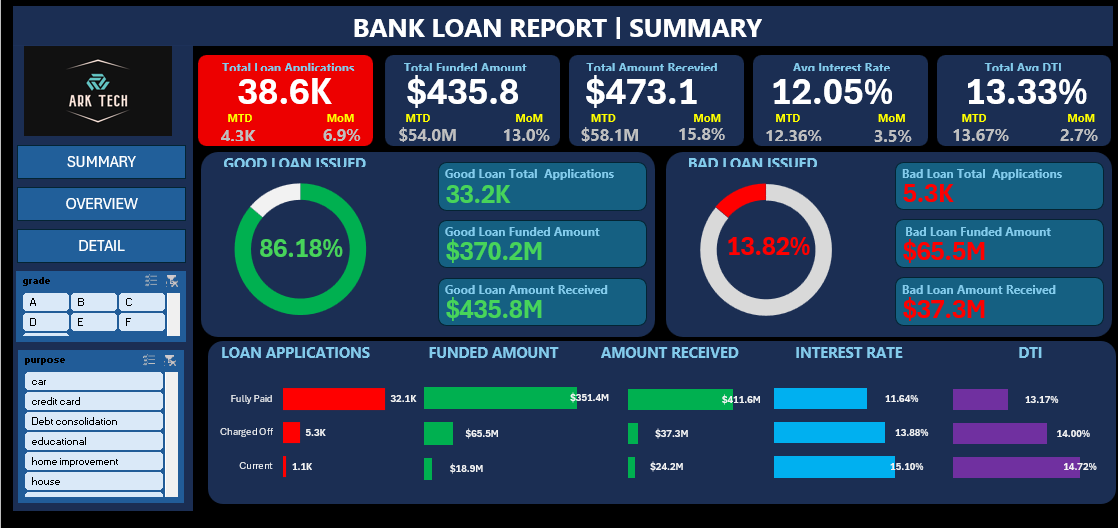
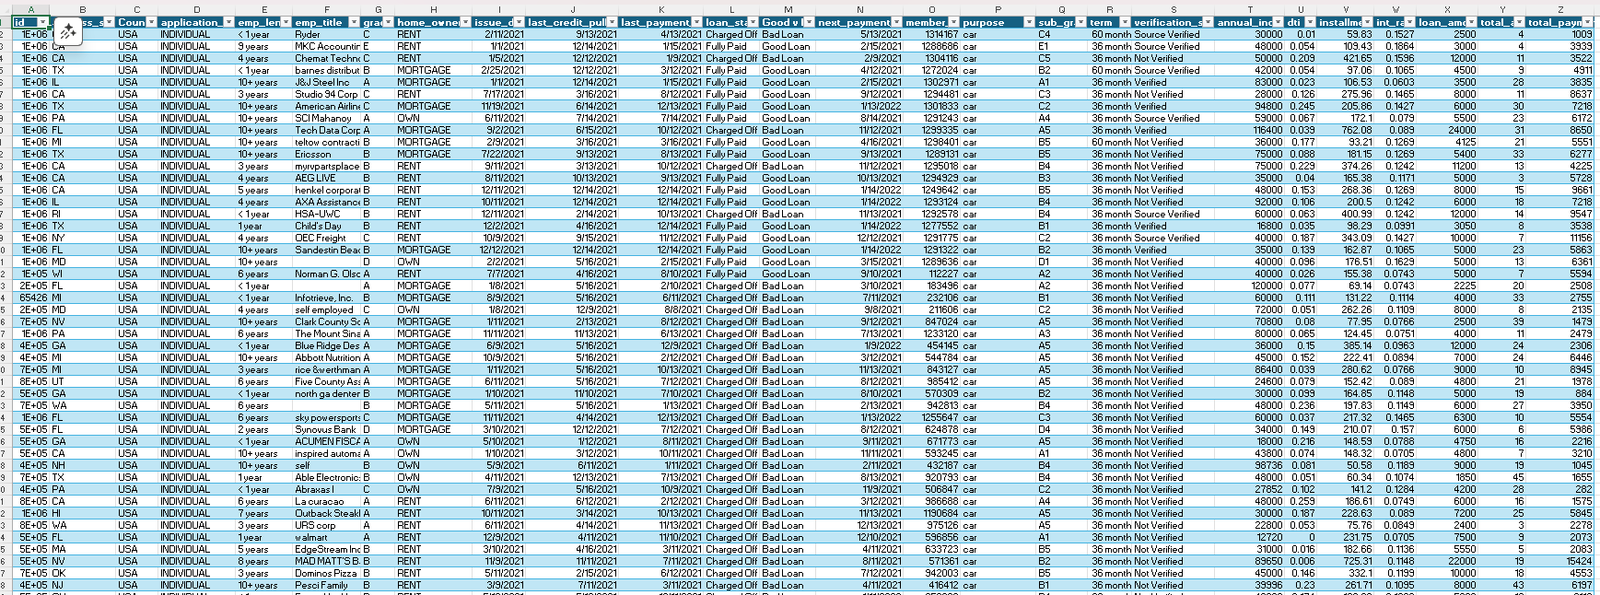
Bank Loan Analysis Dashboard (Power BI Project)
Why: Built to evaluate loan portfolio performance and borrower risk,
identifying default patterns, credit quality issues, and repayment trends.
How: Designed a star-schema data model, implemented advanced DAX KPIs
(default rate, funded amount, repayment ratio), and built interactive Power BI visuals
with scenario-based filtering.
Impact: Enables data-driven credit risk assessment, faster identification
of high-risk segments, and improved lending decision support.
Tools: Power BI, DAX, SQL
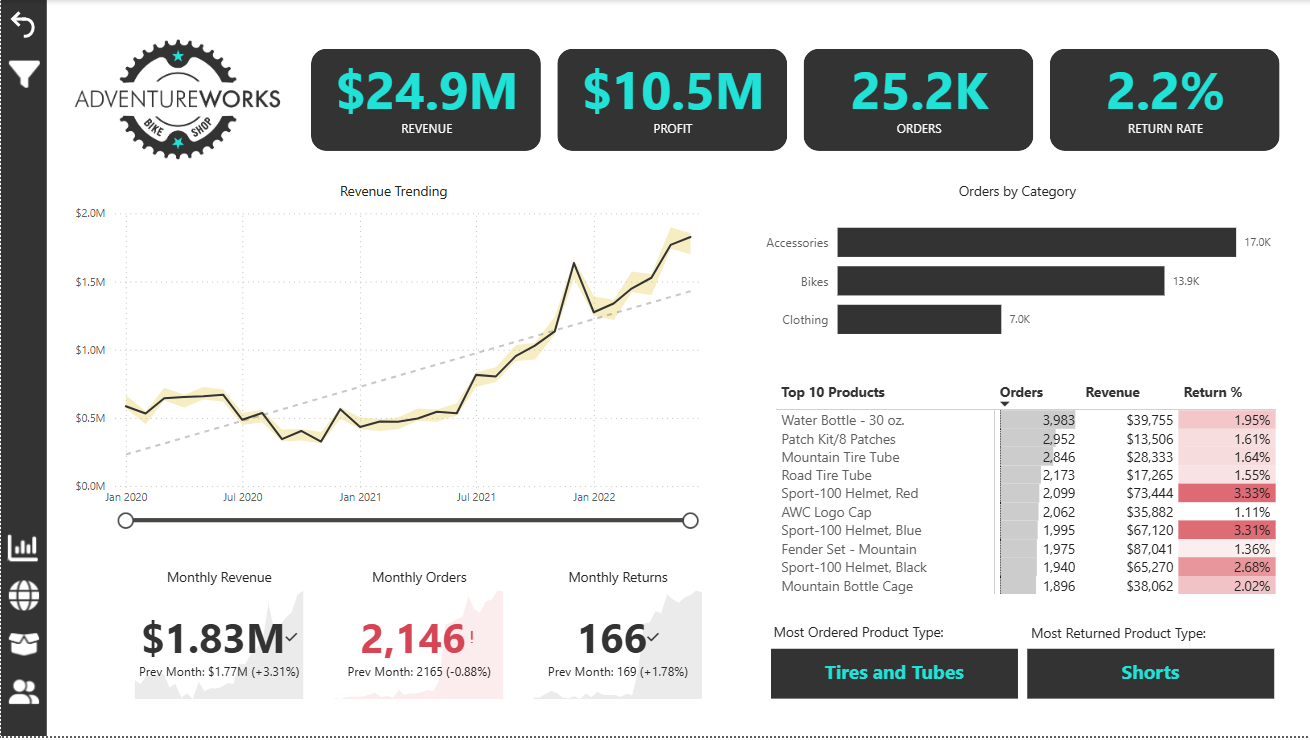
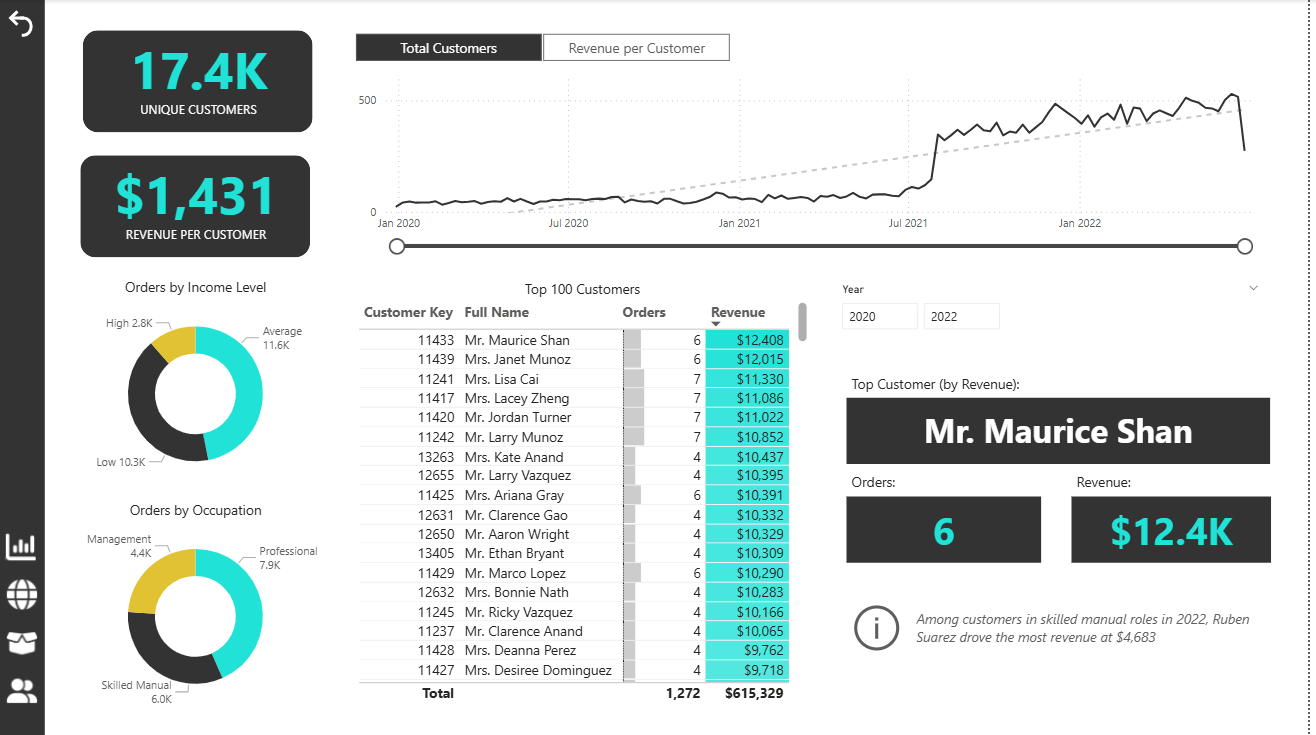
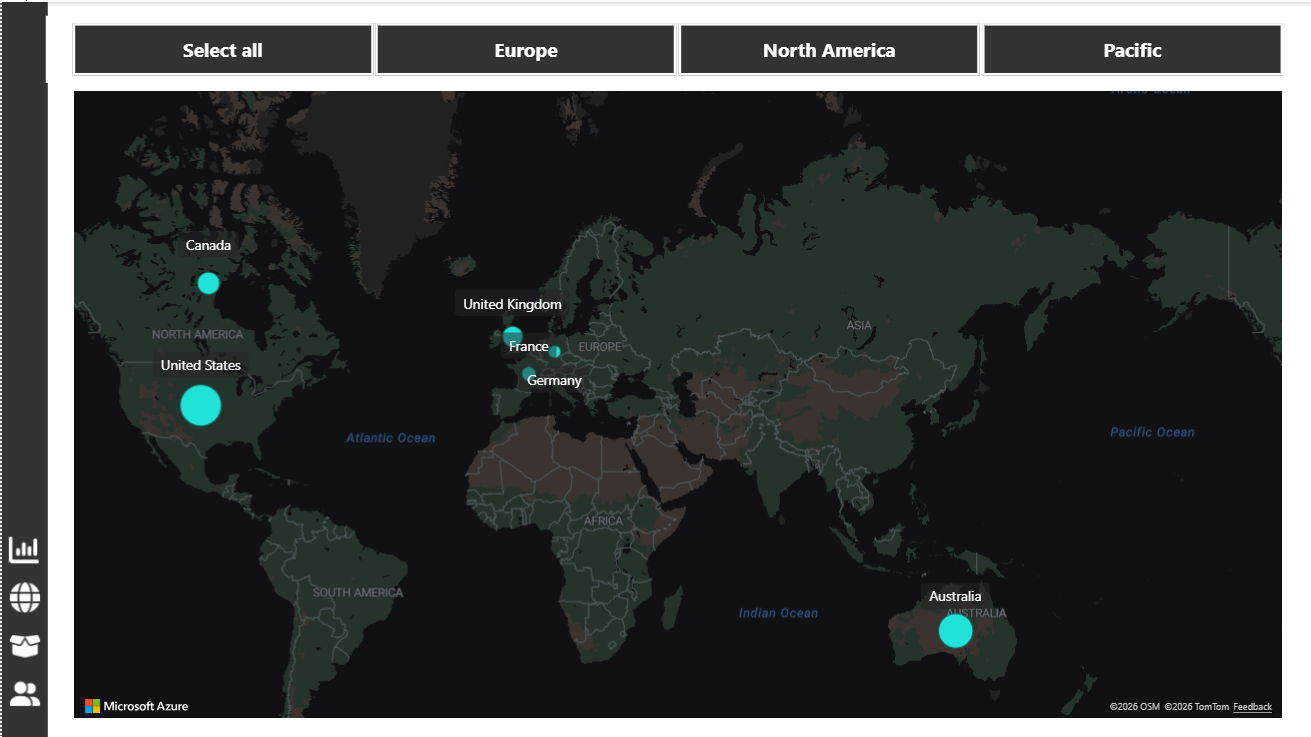
Retail Sales & Customer Insights (Power BI Project)
Why: Developed to analyze retail sales performance and customer behavior,
uncovering purchasing patterns and regional demand.
How: Modeled transactional retail data, built dynamic KPIs for revenue,
orders, and returns, and enabled drill-down analysis across customers and products.
Impact: Supports data-driven merchandising, customer segmentation,
and regional strategy through actionable insights.
Tools: Power BI, DAX, SQL
Bank Loan Analytics Dashboard (Excel Project) (Project In progress)
Why: Built to analyze loan portfolio health, repayment behavior,
and credit risk using Excel-based analytics.
How: Designed interactive Pivot Tables and Pivot Charts,
implemented calculated fields and slicers, and structured the workbook
as an executive-ready dashboard.
Impact: Enables fast portfolio assessment, risk segmentation,
and decision support using a widely adopted analytics tool.
Tools: Microsoft Excel, Pivot Tables, Pivot Charts
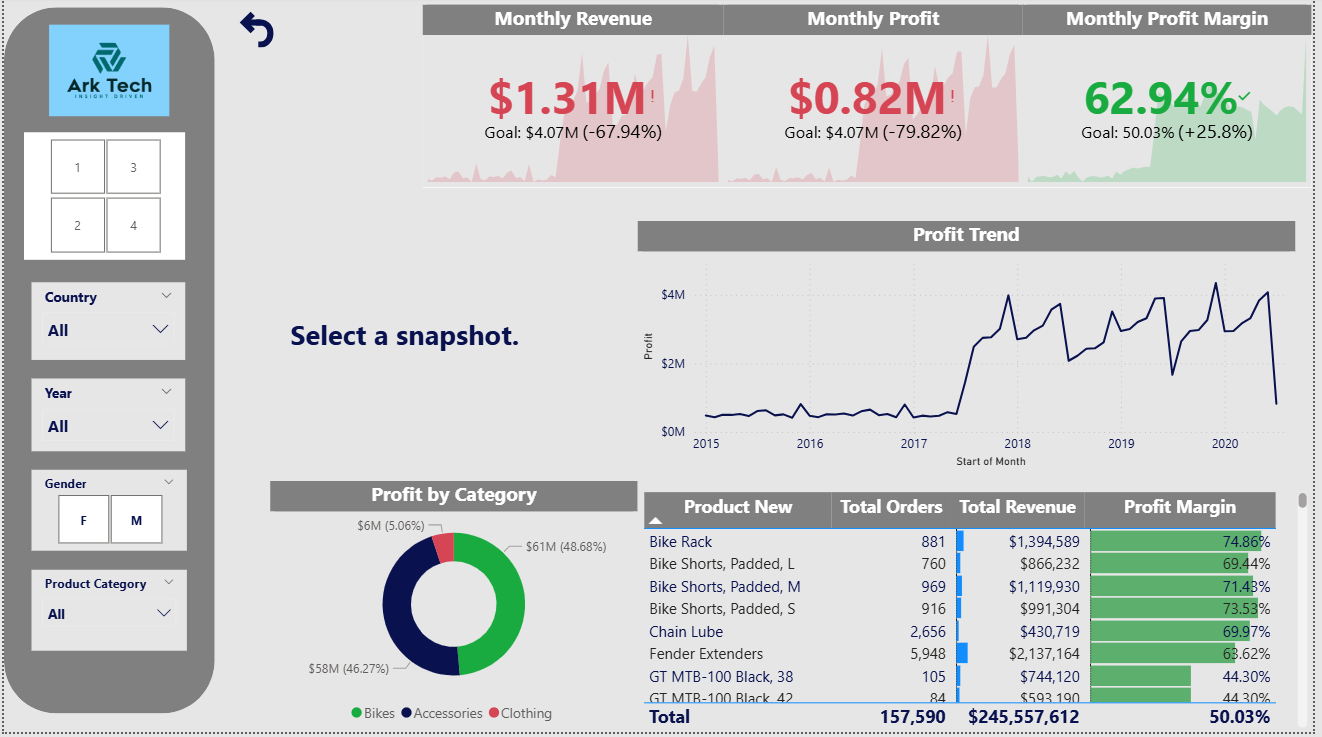
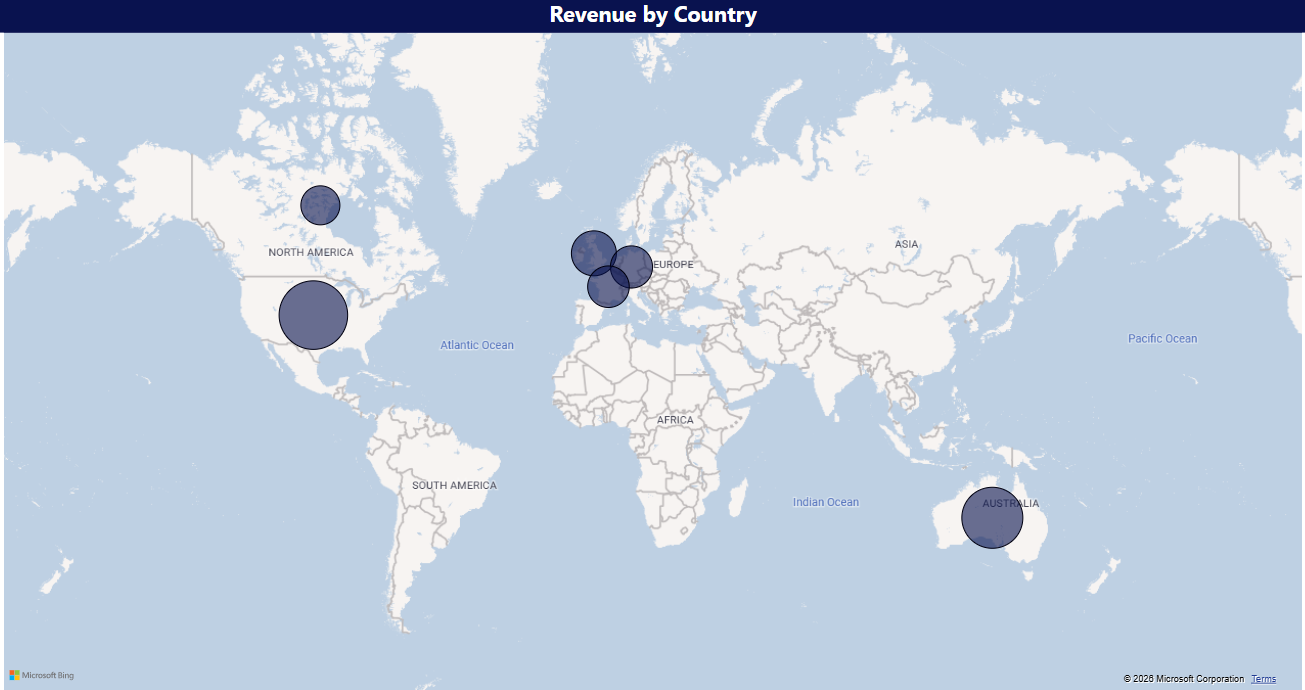
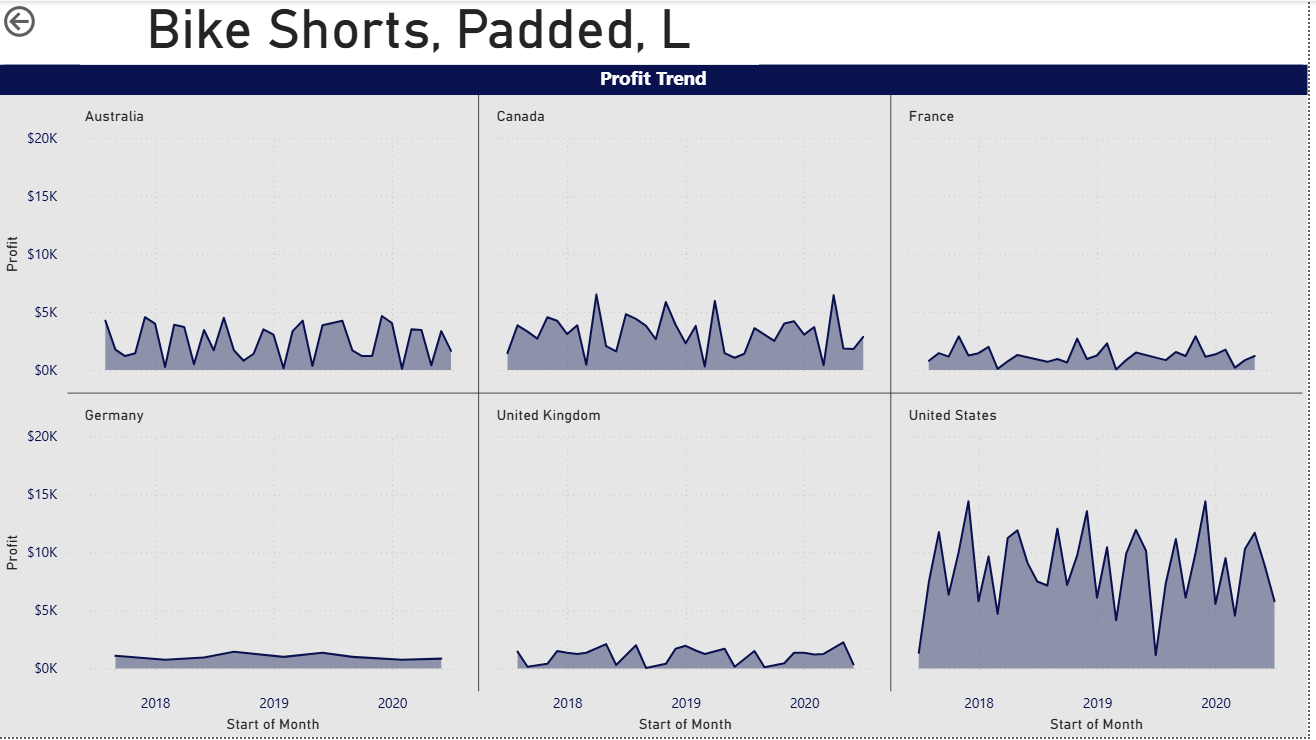
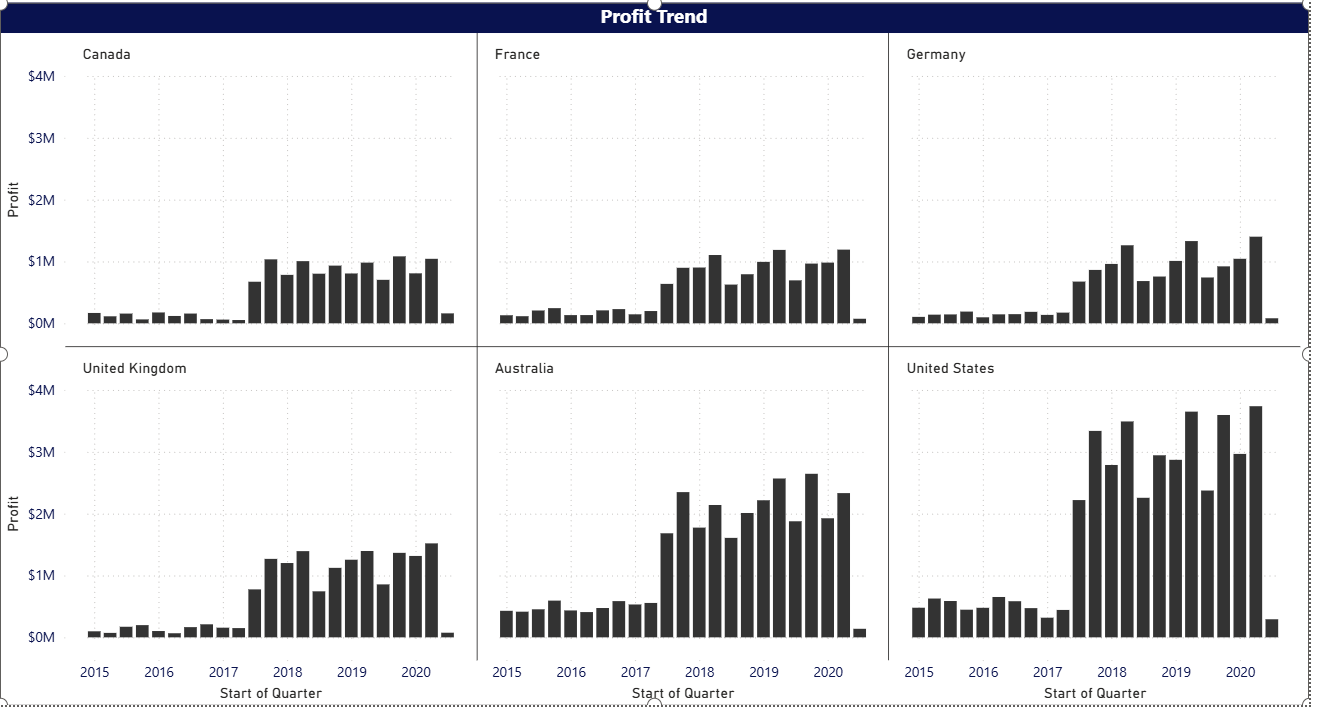
Bicycle Sales & Profit Performance (Power BI Project) (Project In progress)
Why: Created to provide executive visibility into global sales,
profitability, and regional performance trends.
How: Integrated multi-region sales data, developed calculated measures
for revenue, profit, and margins, and built geographic and trend-based Power BI visuals.
Impact: Helps leadership identify high-performing markets, optimize
product mix, and monitor profitability drivers across regions.
Tools: Power BI, DAX, SQL
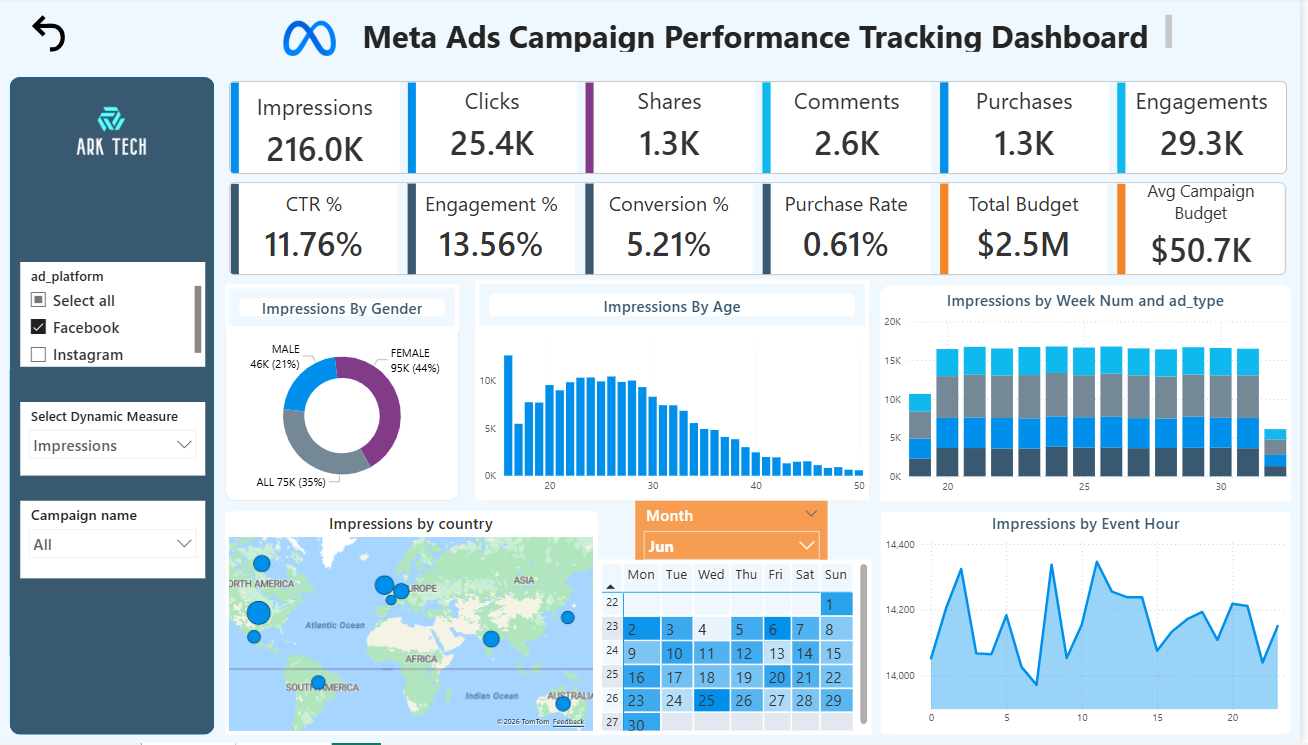
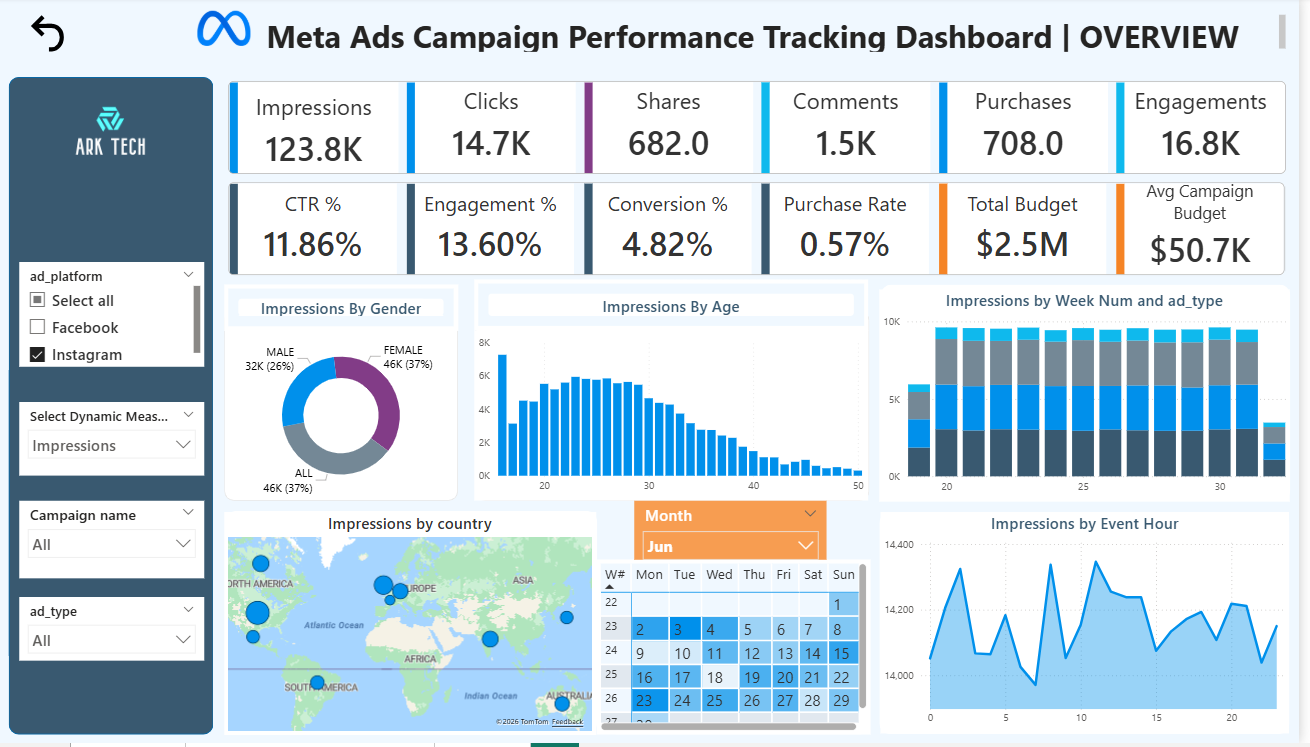
Meta Ads Campaign Performance Dashboard (Power BI) (Project In progress)
Why: Built to track and optimize digital marketing performance across Meta platforms,
providing visibility into impressions, engagement, conversions, and ROI.
How: Modeled event-level ad data, created KPI measures for CTR, engagement rate,
conversion rate, and purchase rate, and enabled demographic, geographic, and time-based analysis.
Impact: Enables marketing teams to evaluate campaign efficiency, identify
high-performing audiences, and optimize budget allocation.
Tools: Power BI, DAX, SQL, Data Modeling
About ArkTech
ArkTech is a data-first analytics practice built around turning operational and financial data into
governed, decision-ready reporting. I design and deliver end-to-end BI solutions—semantic models,
ETL workflows, and executive dashboards—that translate complex datasets into KPIs stakeholders can
trust and act on.
Analytics Engineering (BI)Power BI, DAX, SSAS, semantic modeling, KPI frameworks, performance optimization, and row-level security for governed analytics.
Data EngineeringSQL and Python pipelines for ingestion, cleansing, validation, standardization, and reusable reporting layers.
Data Quality & GovernanceIntegrity checks, discrepancy analysis, documentation, and stakeholder alignment to ensure trusted reporting.
Business ImpactAutomated reporting, accelerated decision cycles, improved financial visibility, and operational insight.
Always learning, continuously sharpening analytics and data engineering skills through ongoing training and hands-on project builds.